

Abstract
Why do some digital services become part of daily life while others remain difficult to use? This working paper studies Egypt through access, trust, age, hospital workflows, business costs, security, reliability, and environmental limits. We analyze a frozen World Bank internet-use series, review source-scoped Egyptian and international research, and execute a local SQLite failure-and-retry benchmark. Egypt’s internet-use value was 74.65% in the latest common comparison year, 2024. That measure does not explain motives or task skills. The reliability test applied 500 synthetic jobs: retries without an operation key created 50 duplicate effects, while transactional keyed retries created none under the same bounded trace. A separate 50,000-draw financial scenario explores chosen assumptions, not measured Egyptian returns. The evidence supports testing specific barriers and useful outcomes instead of treating Egyptians as one group that accepts or rejects technology. This paper publishes code, aggregate data, definitions, limits, and an editable decision model. It does not estimate national fear, rank every city, or predict complete adoption.
The wrong question can give us the wrong product
Do Egyptians dislike technology? It is an easy question to ask. It is also too wide to guide a useful product. A person may enjoy a payment app, avoid an online medical visit, and ask a family member to fill in a government form. Those choices can exist in the same life. Calling that person afraid of technology hides the work we need to do.
I want Softworks Labs to start with a better question: what makes a digital service worth trusting, learning, and using again? This paper looks at Egypt through that question. It joins public statistics, local studies, and small engineering experiments. It also leaves some questions open. A clear gap in the evidence is more useful than a confident story built on a guess.
Our main finding is simple. Internet use is not the same as useful digital adoption. A working connection helps, but people also need a clear price, an understandable process, support, and a safe way back when something goes wrong. For a business, the system must fit real work. For a patient, it must respect privacy and clinical responsibility. For an older person, it should allow learning without shame.
This is an applied working paper from Softworks Labs. We did not survey the Egyptian population or test patients. The new contribution is a checked public-data pipeline, a clear comparison of different kinds of evidence, a reproducible reliability experiment, and a practical way to test an automation decision.
Connection is only the beginning.
- 01Access
I have a suitable device and connection.
- 02Understanding
I know the next step and why it matters.
- 03Trust
I know who is responsible and what my rights are.
- 04Completion
I finished my goal without hidden help.
- 05Return
The service is worth using again.
How we built the evidence
The review includes sources available by 4 November 2026. We searched official statistics, university research, published studies, company case reports, and a small set of public discussions. This is a targeted review. It is not a systematic review of every paper, and it is not a meta-analysis. We did not combine unrelated studies into one national score.
Every important number needs four labels: what was measured, who was included, when it was observed, and where it came from. Publication year and observation year often differ. A report published in 2026 may describe 2025 work. A current website can still display an older survey. Our files preserve these differences instead of replacing every date with “today”.
We used the World Bank API for national internet-use data. The underlying indicator comes from the International Telecommunication Union. The downloaded snapshot reports an update on 8 October 2026. We kept the raw response, calculated file hashes, and produced tidy tables with Python. A hash is a short digital fingerprint that helps identify an exact file. Our public package contains source notes, calculations, checks, and clearly marked synthetic results. D01
We gave different evidence different jobs. A national indicator describes broad access. A campus study helps us ask better hospital questions. A company success story shows a possible use, but does not prove a typical return. A public post can reveal a confusing step, but cannot tell us how common the problem is. This separation is central to the paper, not a small warning at the end.
Egypt is connected, but connection is only the beginning
For a fair comparison, we selected the latest year available for Egypt and all four regional peers in this download: 2024. Internet use was 74.65% in Egypt, 76.50% in Tunisia, 87.31% in Türkiye, 91.20% in Morocco, and 95.62% in Jordan. The world value was 71.20%. These are shares of individuals who used the internet from any location in the last three months, not household subscriptions or shares using AI. D01
Egypt was therefore about 3.45 percentage points above the world value, but below these four peers. A percentage point is the direct difference between two percentages. Morocco’s lead over Egypt was about 16.55 points. That is different from saying Morocco was 16.55% higher. The chart keeps the same year and measure across countries so that the comparison stays meaningful.
The long series is useful because a single year hides movement. Egypt rose from about 37.82% in 2015 to 74.65% in 2024, a gain of 36.83 percentage points. Its gap against the world moved from −2.08 points in 2015 to +11.81 in 2020 and +3.45 in 2024. Choosing only one of those years changes the story. These differences do not identify the effect of a policy or the pandemic. D01
Sources can revise earlier observations, and missing values do not mean zero use. We found an older mirror of the series with a different historical world value. We chose the original API snapshot and recorded that choice. A later reader may download a revised series and get a different result without either person making an arithmetic mistake.
These numbers cannot tell us how often someone uses the internet, whether their connection is reliable, or whether they can finish a form alone. A person who uses messaging once may be counted as an internet user. That does not make a complex business tool easy for them. The practical lesson is to test the actual task, not use national internet access as a substitute for usability research.
A fair comparison starts with the same definition.
The small words around a number matter
Imagine two statements: “half the doctors use a service” and “half the people use a service”. They sound close. They describe different populations. The denominator is the group under the fraction. If that group changes, the meaning changes with it. Many weak technology arguments come from losing this small detail while moving a number from a paper to a slide.
We use three rules. First, keep people, households, businesses, and recorded events separate. Second, keep a willingness answer separate from a completed action. Third, keep a percentage of users separate from a percentage of everyone. A feature can be popular among a small group of active users while still reaching very few people overall.
The same care applies to missing data. Our requested World Bank low- and middle-income aggregate, code LMY, returned no values in this snapshot. We did not fill that gap from an older mirror and present it as the same release. Tunisia also had gaps in the requested years. The public data keeps those cells empty. A line chart should not turn an unknown year into a measured point.
There is a useful test for any chart in a business meeting: can someone explain its unit, period, population, and source in one sentence? If not, the chart is not ready to support a decision. More decimal places will not fix that problem. We round values for reading, preserve the original precision in the data, and use direct differences only where the definitions match.
Access changed. Trust is another question.
Read the numbers behind this chart
| Year | Egypt % | Morocco % |
|---|---|---|
| 2000 | 0.64 | 0.69 |
| 2001 | 0.84 | 1.37 |
| 2002 | 2.72 | 2.37 |
| 2003 | 4.04 | 3.35 |
| 2004 | 11.92 | 11.61 |
| 2005 | 12.75 | 15.08 |
| 2006 | 13.66 | 19.77 |
| 2007 | 16.03 | 21.5 |
| 2008 | 18.01 | 33.1 |
| 2009 | 20 | 41.3 |
| 2010 | 21.6 | 52 |
| 2011 | 25.6 | 46.11 |
| 2012 | 26.4 | 55.42 |
| 2013 | 29.4 | 56 |
| 2014 | 33.89 | 56.77 |
| 2015 | 37.82 | 57.08 |
| 2016 | 41.25 | 58.27 |
| 2017 | 44.95 | 61.76 |
| 2018 | 46.92 | 64.8 |
| 2019 | 57.28 | 84.12 |
| 2020 | 71.91 | 84.12 |
| 2021 | 72.06 | 88.13 |
| 2022 | 72.2 | 89.9 |
| 2023 | 74.01 | 91 |
| 2024 | 74.65 | 91.2 |
| 2025 | Unavailable | Unavailable |
Age is a design question, not a judgement about people
The ITU Egypt dashboard reports 2022 internet use of 93% for ages 15–24 and 65% for ages 25–74. It also reports household access of 84% in urban areas and 64% in rural areas. These are different measures with different denominators. Its oldest-age observation is from 2018, so we do not place it beside 2022 groups as a current age comparison. C01
A broad group such as 25–74 cannot explain the experience of a person aged 68. Age may overlap with income, schooling, work, health, device access, and help from other people. These data do not separate those pathways. We should not turn an age gap into a claim that older people are unable or unwilling to learn.
For product design, I would test practical barriers one at a time. Can the person read the screen without zooming every line? Does the button name match the action? Is there enough time to read a message before it disappears? Can a mistake be corrected? Can the person speak to a real helper without losing their place? These are testable questions. “Old people do not like apps” is not.
Family support can be valuable, but it can also hide dependence. A completed online form may mean that a younger relative did all the work. In a pilot, ask who completed each step and whether the user wanted that help. Offer a clear permission model for trusted support. Do not solve access by encouraging families to share passwords or quietly remove the older person’s control.
Every number has a population.
The internet-use indicator. Not a trust score or the adoption rate of a particular service.
Formal private establishments within the survey rules. Not hospitals or every microbusiness.
The calculator and sensitivity tests explore our assumptions. They do not predict an Egyptian company’s profit.
What people may be protecting when they hesitate
Fear is one possible reason for refusal. It is not the only one. A person may protect money, privacy, time, dignity, or the ability to ask a question. If a service has failed before, caution may be a sensible response. Our evidence does not provide a national percentage for “fear of technology”, and this paper does not create one.
A qualitative Egyptian study included 41 internet users and eight physicians. It found mixed feelings around online health information and the importance of communication with physicians. These are themes from a small selected group, not percentages of Egyptians. They suggest that useful digital activity and uncertainty can exist together. L05
The following is a design hypothesis, not a measured psychological model of Egypt. A person weighs an expected benefit against the effort to learn, the possible loss, and the difficulty of getting help. A small chance of a serious loss can matter more than a small saving in time. That is especially relevant when the person cannot easily replace lost money or repeat a long trip.
A useful interface therefore explains the next step before asking for commitment. Show the total price. Say what happens after submission. Give a receipt that can be found later. Explain who can see the information and how to correct it. Make cancellation and support visible. Test whether these changes improve completion and confidence. Do not assume that a trust badge, a friendly illustration, or an AI label has solved the underlying problem.
A city map should not pretend to know more than the data
Egypt is not one user journey. A service may work differently across districts, workplaces, and households inside the same city. We found a 2023 survey covering Cairo, Alexandria, and Port Said. It interviewed 600 people aged 16–35 by telephone, 200 in each city, about household conditions. That is a narrow source for discussing city context, not a current national ranking of digital readiness. C02
During review, we found an inconsistency on page 53 between the narrative and chart for Alexandria’s “seldom” response. We excluded the disputed cell. More importantly, we did not make a colourful map of every governorate from a three-city sample. An attractive map can make weak coverage look complete.
Our city panel therefore shows research coverage and practical questions. For Cairo, a pilot can test whether a service reduces repeated travel between offices. In Alexandria, it can test the handoff between online requests and physical service desks. In Port Said, it can test document status and support ownership in a trading workflow. These are proposed studies, not claims that those are each city’s main problem.
For rural communities and Upper Egypt, the first task is to recruit people rather than extend assumptions from a capital-city sample. Include users with shared phones, limited data, low literacy, and unstable access. Record the place and conditions of each test. A local comparison becomes useful when the same task and method are repeated across places. Until then, the honest visual is a coverage diagram with clear gaps.
Where was the evidence collected?
These are counts of surveyed establishments by region. They are not technology-adoption rates and cannot rank cities.
A hospital needs a working path, not just a new app
At Tanta University’s medical campus, a convenience sample included 500 physicians and 500 employees in late 2023 and early 2024. Among physicians, 245 had used telemedicine. Of the 255 non-users, 156 wanted to try. Among the 245 users, 170 reported text messaging and 16 a personalised platform; multiple answers were allowed. This is one campus, not all Egyptian hospitals. L01
The result makes a simple “doctors reject technology” story difficult to defend. Some people were already using familiar tools. Others expressed interest without using them. That difference gives us a product question: what must change between interest and safe, repeated use? The study alone cannot tell us which intervention would work.
An AUC master’s thesis used responses from 177 healthcare providers and interviews with seven experts. Its repository abstract identifies financial concerns, technical support, training, and data security as barriers. We verified the abstract, not the full restricted download, and do not assign a percentage to those themes. L02
A newer Mansoura study included 532 adult internet-using primary-care attendees. It classified 32.7% as having limited electronic health literacy under its chosen self-report scale and cutoff. It excluded non-users and people unable to read or write. Its mainly young sample cannot represent older Egyptians. L03
For a hospital pilot, begin with a bounded administrative task, such as explaining appointment requirements. Keep a named human responsible for exceptions. Measure wrong instructions, repeated calls, staff review time, and whether patients can reach help. Clinical decisions require a different validation process. Our small software experiment below is not clinical evidence and does not establish that an AI medical system is safe.
Scams use confusion as well as weak software
An official banking advisory warns against people requesting confidential banking information through calls or social media. It directs customers to official channels. This is prevention guidance, not a count of victims. It supports a clear design principle: a service should help users recognise the real channel before a stranger creates urgency. L09
On 23 October 2026, Egypt’s Ministry of Interior reported arrests in a case involving allegedly fake discounted AI subscriptions. According to the police account, social pages collected advance payments and then cut contact. We did not verify a court outcome. The case illustrates a pattern; it does not measure how common that pattern is. L10
INTERPOL reported 12,281 ransomware detections attributed to Egypt in 2024 in Trend Micro data. A detection is not a unique victim, a successful breach, or a hacked company. Coverage depends on the vendor’s systems. We do not divide that number by Egypt’s population to create an individual risk rate. L11
Our practical response is to reduce ambiguity. A payment screen should make the payee, amount, and result clear. Support should never need a user to reveal a one-time code. Account recovery needs careful checks because it can become a second entrance to an account. Staff need a safe way to pause a suspicious request without pressure to finish it quickly.
For users, the simple rule is to stop, leave the message, and contact the institution through a known official route. For builders, the harder job is to make that route easy to find and make help responsive. Blaming a person after a confusing failure teaches the next person to hide a problem. Good recovery is part of adoption.
What public conversations add, and what they cannot add
We reviewed five selected public Reddit discussions. They included concern about unfamiliar card payments, interest in automatic expense tracking, questions about paid-app value, a wish to connect services, and confusion over which organisation should solve a payment problem. These are unverified personal accounts. We retained no handles, private details, or claimed national sentiment score. F01 F02 F03 F04 F05
The selection is small, finance-focused, and shaped by search results. People who post online already differ from many people who do not. A thread full of complaints can reflect where people seek help, not the average service experience. We found no usable no-login X sample, so there is no invented analysis of Egyptian tweets.
The useful output is a list of research questions. Does a customer know who owns a failed transfer? Can they tell whether an action is pending or complete? Do existing apps connect well enough for everyday work? Is a subscription’s extra value clear? A product team can test those questions directly with recruited users.
This is also why we did not run a sentiment model and publish a negative-percentage headline. A model can count labels on a selected set of posts very precisely while answering the wrong population question. Better analysis starts with the sampling problem. More computing power cannot repair a dataset that never included the people we want to understand.
Small firms face a different decision
The World Bank’s Egypt 2025 Enterprise Survey interviewed 1,024 establishments between September 2025 and January 2026. It covers eligible formal private businesses with at least five employees. It excludes several sectors, including healthcare and education, and does not represent every microbusiness or informal seller. Its published weighted estimates show that 35.6% experienced electrical outages and 7.7% offered formal training. Weighting adjusts how much each sampled firm contributes to the estimate. D02
Those two figures describe different conditions. They do not show that lack of training caused outages or that either caused resistance to AI. The size breakdown also resists a simple story: reported outage exposure was 46.2% for medium firms, compared with 34.4% for small and 29.7% for large firms. Bigger was not always better in this measure. D02
A separate ERF working paper using 2022 firm data reports website use of 32% among small Egyptian firms and 84% among large firms. We keep its size definitions separate from the World Bank survey. A website is also a narrow measure of digitisation; a seller may use messaging or payments without owning one. L06
A small company has to pay for setup, learning, maintenance, and mistakes. Those costs arrive before a promised saving becomes real. If work volume is low, a manual step can remain cheaper. If a process changes every week, automation can move the work into debugging. The useful question is not whether the owner is modern. It is whether the new process produces better completed work at a sustainable total cost.
Firm size changes the picture.
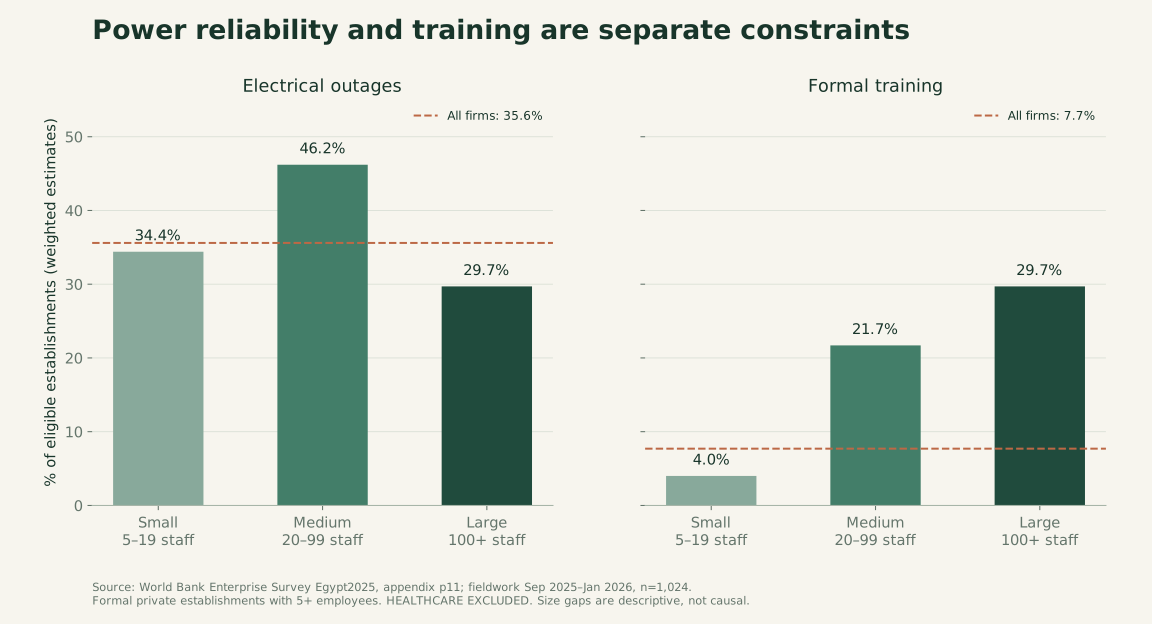
All values and definitions
| Indicator · % | Total | Small | Medium | Large |
|---|---|---|---|---|
| Firms experiencing electrical outages | 35.6 | 34.4 | 46.2 | 29.7 |
| Firms offering formal training | 7.7 | 4 | 21.7 | 29.7 |
| Firms with a checking or savings account | 75.3 | 70.4 | 95.9 | 100 |
| Firms introducing a new product or service | 9 | 7.2 | 19.3 | 11 |
| Firms introducing a process innovation | 3.2 | 2 | 9.5 | 6.8 |
| Electricity named the biggest obstacle | 16.2 | 16.3 | 14.4 | 19.2 |
Sizes: small 5–19 employees; medium 20–99; large 100+. The comparison is descriptive, with no claim of statistical significance. Sample shares are not population weights.
What large-company evidence can teach a smaller team
The final published version of “Generative AI at Work” studied 5,172 customer-support agents at one company. Access to an AI assistant increased resolved issues per hour by about 15% on average, with different effects across workers. It was a workplace rollout study, not an estimate of Egyptian company returns. L12
A separate randomised experiment with 453 professionals found that assisted writing tasks took 40% less time and received 18% higher quality scores. These were bounded writing tasks. Neither figure means a whole company will gain the same amount in revenue or profit. L13
There is also a useful counterexample. METR’s study of early-2025 tools involved 16 experienced developers and 246 tasks in familiar repositories. AI-allowed work took 19% longer in that setting. It does not describe all coding or the tools available in November 2026. Together, these studies show why we should measure the task and context instead of promising one universal AI gain. L18
In Egypt, a B.TECH and McKinsey case report claims a 4% gross-profit uplift from AI pricing. It separately reports a 14% conversion uplift from e-commerce changes. These are client and consultancy claims with limited public methods, not independently verified effects from our research. We do not add the two numbers together. L15
A small team can copy the discipline of a bounded test without copying a large company’s budget. Select a repeatable task, define acceptable quality, log review and repair time, and compare with the existing process. A faster first draft is useful only if the final work is correct enough to use.
Electricity changes the design, but does not explain every decision
An outage can stop a local machine, a router, or a work session. A cloud service may remain online while the employee cannot reach it. This creates a gap between a provider’s uptime and the user’s ability to finish work. A useful service needs to think about both ends of the connection.
The enterprise survey establishes reported exposure among its eligible firms. It does not identify how much foreign investment was lost because of power reliability. We found no defensible causal estimate for that question in this review. Prices, demand, financing, policy, skills, and risk can all enter an investment decision. Assigning the whole decision to electricity would be a stronger claim than the evidence allows.
Our engineering response is a proposal: save progress early, keep a clear pending state, use a durable queue where appropriate, and make repeated requests safe. If a connection fails after a request reaches the server, the user may not know whether it worked. Pressing again should not create a second bill or booking.
This is where idempotency helps. It means that repeating the same intended action does not repeat its side effect. The server keeps a record of the action’s unique key and returns the earlier result when the request is repeated. A key alone is not enough. The key and the action need correct transaction handling, suitable retention, and checks that the repeated request has the same meaning.
A fallback should also be tested as a real service. Paper or a phone call is not automatically reliable. Decide how offline work returns to the main record, who resolves conflicts, and how users know which state is final. Continuity is a workflow, not simply a backup generator or another button.
The reply was lost. Should the work happen twice?
Every fifth request is repeated in this example. Compare a simple counter with a stable ID for every job. This shows behaviour; it is not a performance benchmark of a real server.
- 01Apply the job
- 02Reply is lost
- 03Retry the same ID
- 04Recognise prior work
Run the example to see the result on your device.
Read the code
const attempts = [];
for (let i = 1; i <= jobs; i++) {
  attempts.push(`job-${i}`);
  if (i % 5 === 0) attempts.push(`job-${i}`);
}
const naiveEffects = attempts.length;
const deduplicatedEffects = new Set(attempts).size;
In production, recording the ID and changing the state must happen safely together in the database. A browser Set does not protect against lost memory or concurrent requests.
Count the whole cost of a completed task
Consider a hypothetical company processing 2,000 requests a month. Manual work takes eight minutes each. That is 16,000 minutes, or about 266.7 hours. At an assumed loaded labour cost of EGP 60 per hour, the time costs EGP 16,000. “Loaded” means the full cost attached to the work, not a claim about a typical Egyptian wage.
Now suppose automation still needs 1.5 minutes of handling and two minutes of review per request. If 5% of requests need ten extra minutes of repair, the average total becomes four minutes. That releases about 133.3 hours, valued at EGP 8,000. Subtract an assumed EGP 2,500 monthly service cost and EGP 800 of additional disruption cost: four hours at EGP 200 per affected hour. The modelled net monthly value is EGP 4,700.
The equation is: net monthly value = jobs × (manual minutes − automated handling minutes − review minutes − error share × repair minutes) ÷ 60 × hourly cost − service cost − additional disruption cost. If setup costs EGP 12,000, simple payback is about 2.55 months at EGP 4,700 per month. These are the calculator’s defaults: an illustration, not a forecast, market price, or measured client result. Count disruption only when it is additional; do not also deduct the same lost work from job volume.
Saved hours are not automatically cash in a bank account. A business may use them to reduce queues, improve service, or handle more work with the same team. Revenue only rises if there is demand and the company can deliver. Our calculator keeps these assumptions visible so the reader can change them rather than accept a single attractive ROI figure.
Quality should be a constraint, not an afterthought. A cheap workflow that sends the wrong invoice may be more expensive than the old one. For each task, count accepted completions, corrections, unresolved cases, and the time of everyone involved. Decide what level of error makes a system unacceptable before seeing the result.
When does automation become useful?
Change the assumptions. The starting values are teaching inputs, not results from an Egyptian company or a profit forecast. The calculation runs on your device.
- Time released
- 133.3 hours
- Simple setup payback
- 2.6 months
Saved time is not automatically cash in the bank. It must become useful work or an actual cost reduction.
See the equation and its limits
released_hours = jobs × (manual_min − automated_min − review_min
                 − rework_rate × rework_min) ÷ 60
net = released_hours × hourly_value − monthly_cost
      − outage_hours × affected_hourly_value
payback_months = setup_cost ÷ net  (only when net > 0)
The model assumes stable workload and costs. It excludes tax, financing, inflation and case-level quality differences. The outage cost applies only to this workflow, not the whole economy.
Why one precise saving is not enough
The example above uses fixed assumptions. Real work moves. Volume changes, review takes longer on difficult cases, and the failure rate may rise after a supplier changes a format. The accompanying Python analysis uses a seeded Monte Carlo scenario to show how uncertainty in inputs changes the output. Monte Carlo means repeating a calculation with many sampled combinations of assumptions.
We ran 50,000 draws with seed 20261104. Modelled monthly value had a median of about EGP 3,349; the 5th and 95th percentiles were about −EGP 936 and EGP 9,017. About 89.52% of these assumed scenarios were positive. Inputs use independent triangular distributions with stated minimum, most likely, and maximum values; the complete ranges are in the JSON.
This is synthetic analysis. The input ranges are not estimates from Egyptian companies. The output distribution is not a confidence interval for the country, and its positive share is not the chance that your business will succeed. It answers a narrower question: given the chosen model and ranges, how often does this calculation produce a positive monthly value?
The seed makes the run repeatable. Someone using the same code, input settings, and supported environment should get the same simulated draws. Reproducibility does not make the assumptions true. It makes them visible and easier to challenge. That distinction is one reason we publish both the code and the settings.
Before a real purchase, replace the invented ranges with observations from a short pilot. Measure the full distribution of review time, not only its average. Keep difficult cases. Test whether failure and review time rise together; our simple independent-input example does not model all such relationships. Repeat the calculation under a lower work volume and higher repair cost. A decision that only looks good under perfect conditions needs more work.
Change the assumption. Change the result.
We ran 50,000 synthetic draws from chosen, independent input ranges. This shows how sensitive the model is to assumptions. It is not a company profit forecast or a statistical confidence interval.
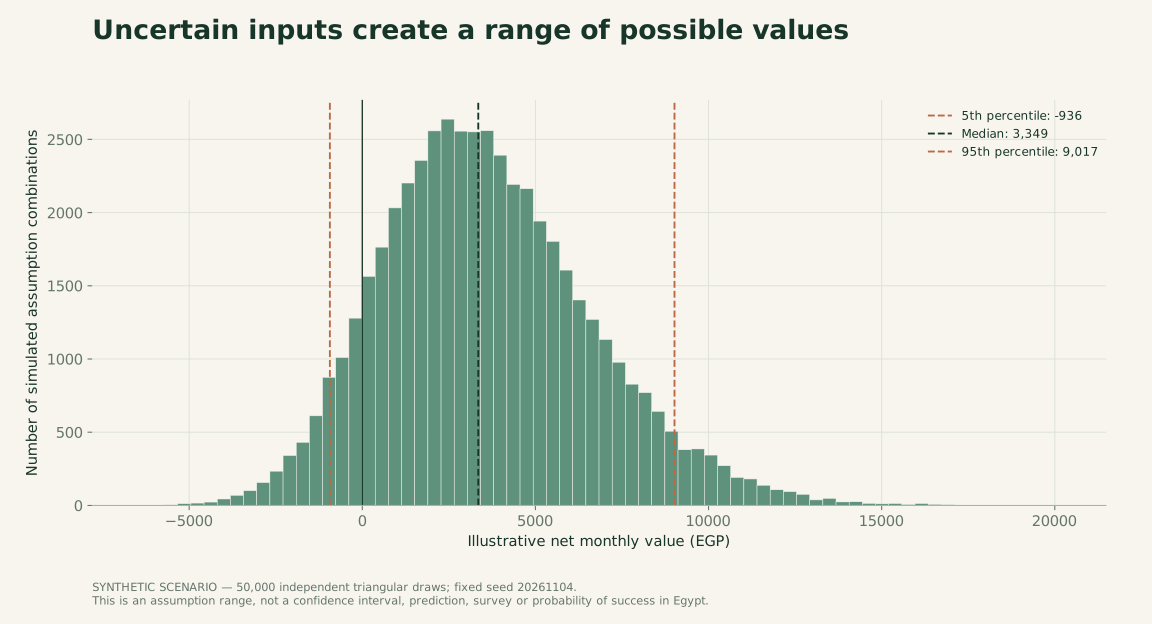
| 5th percentile | Median | 95th percentile |
|---|---|---|
| -936 EGP / month | 3,349 EGP / month | 9,017 EGP / month |
Negative value is possible under some assumptions. The positive share inside the simulation is not a real project’s chance of success.
Which assumption changes the result most?
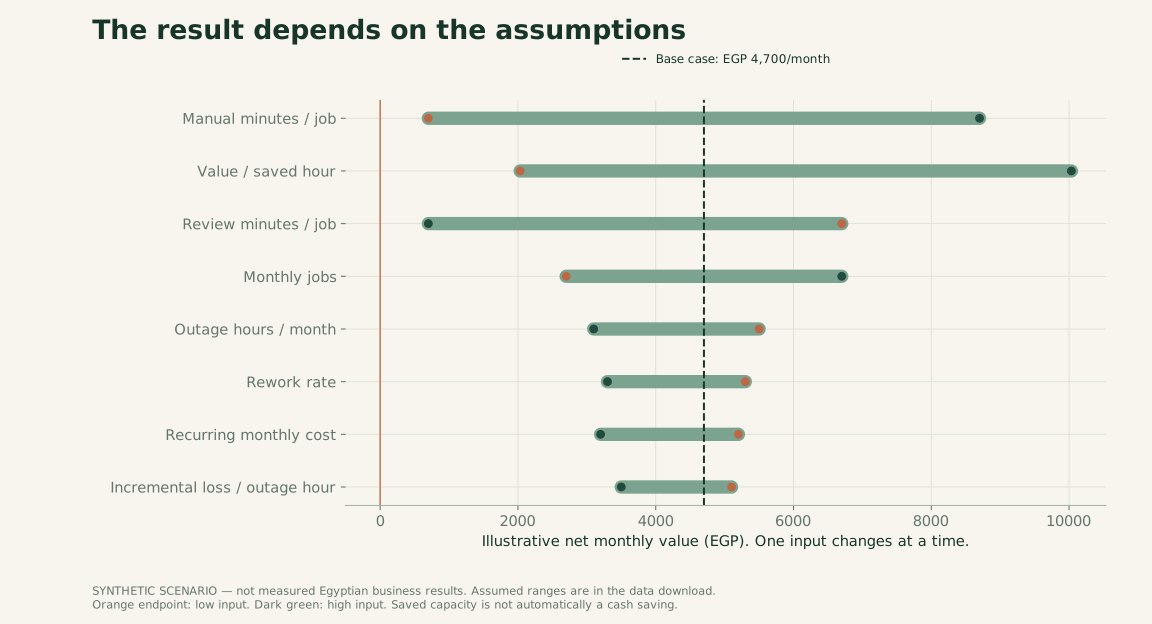
Inspect the sensitivity table
| Code parameter | Low input | High input | Value at low | Value at high |
|---|---|---|---|---|
manualMin | 6 | 10 | 700 | 8,700 |
hourlyCost | 40 | 100 | 2,033 | 10,033 |
reviewMin | 1 | 4 | 6,700 | 700 |
jobs | 1500 | 2500 | 2,700 | 6,700 |
outageHours | 0 | 12 | 5,500 | 3,100 |
errorRate | 0.02 | 0.12 | 5,300 | 3,300 |
recurringCost | 2000 | 4000 | 5,200 | 3,200 |
affectedHourlyValue | 100 | 500 | 5,100 | 3,500 |
A small reliability experiment you can inspect
We built and executed a local SQLite fault-injection benchmark around repeated requests. Fault injection means deliberately creating a controlled failure so that a recovery method can be tested. We compared one-shot delivery, retries without a key, and retries with a transactional operation key. Each strategy received 500 synthetic jobs in each of 20 measured trials after one warm-up. Execution order rotated. No live payment service, patient record, customer account, or production network was involved.
The fixed trace included 125 jobs whose first attempt failed before writing and 50 configured to lose their first confirmation after a successful write; 15 jobs were in both groups. One-shot delivery applied 375 unique jobs, confirmed only 340 to the caller, and left 125 unapplied. Retrying without a key applied all 500 but created 50 duplicate effects. Transactional keyed retries applied all 500 with zero duplicate effects. Both retry paths made 675 attempts. These are measured software outcomes under a deliberately chosen trace, not estimates of real outage frequency.
Median whole-trial elapsed times were about 410 ms, 602 ms, and 585 ms respectively. They describe local SQLite work, not network latency or a proven speed advantage. A separate outbox test closed and reopened database connections twice and finished with 500 unique actions, no duplicates, and no pending jobs. That was not an operating-system crash or a physical power-cut test. Persistent outages, concurrent writers, different keys for the same human intent, external side effects, and key expiry remain outside the test.
The browser example illustrates the same recovery idea in memory; it is not the SQLite benchmark. The Python code and recorded results are the reproducible experiment. Its three-attempt retry budget works for this bounded failure trace. It cannot guarantee delivery through an outage that continues beyond the budget. Production design needs durable queues, backoff, monitoring, and an explicit path for unresolved work.
This is the core transaction from the tested Python implementation. The same transaction records the operation key and its effect. The full file includes the setup, injected failures, retry loop, and assertions.
with self.con:
    added = self.con.execute(
        'INSERT OR IGNORE INTO idempotency(job_id) VALUES (?)',
        (job_id,),
    ).rowcount
    if added:
        self.con.execute(
            'INSERT INTO effects(job_id) VALUES (?)', (job_id,)
        )
The result matters because it connects a human concern to an engineering choice. “I pressed it, but I do not know what happened” is a trust problem with a technical part. A clear status screen and safe recovery can address that part. A cinematic interface alone cannot. Our goal is to make the failure understandable and the recovery inspectable, rather than hide them behind a successful animation.
The same fault. Three different outcomes.
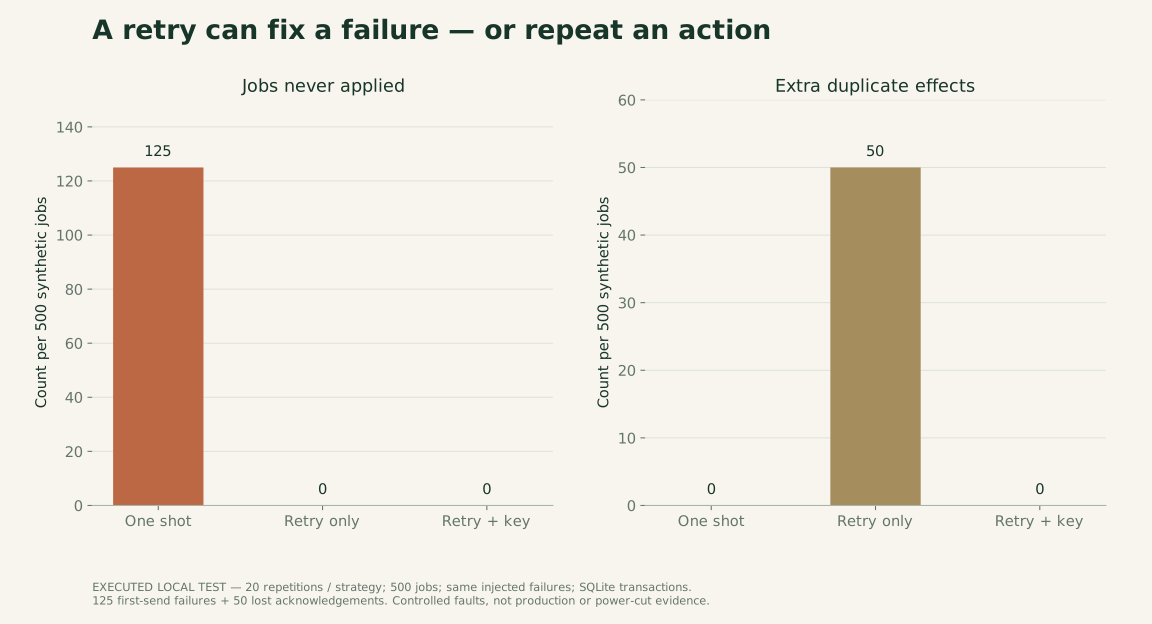
| Strategy | Unique jobs applied | Not applied | Duplicate effects | Median time · ms |
|---|---|---|---|---|
| One attempt | 375 | 125 | 0 | 409.8 |
| Retry without a stable key | 500 | 0 | 50 | 602.5 |
| Retry with a stable key | 500 | 0 | 0 | 585.0 |
How to test a useful service in the real world
For a first field pilot, I would start with one low-risk workflow and a written stop rule. For example, a business could test document-status messages while people keep control of approvals. The team should agree on the task, users, acceptable quality, support path, and observation period before the test begins.
Where practical, randomly assign comparable tasks or users to the existing and proposed process. If random assignment is not possible, record why and describe the comparison as observational. Keep the time period, workload, and rules as similar as possible. A before-and-after improvement may reflect quieter days, more experienced staff, or a changed customer mix.
Choose one main outcome: perhaps total staff minutes per correctly completed request. Also track wrong outputs, repeated visits, unresolved cases, user effort, and help requests. Record the time spent setting up and maintaining the system. An improvement that quietly moves work from staff to customers is not necessarily a service improvement.
Recruit beyond the easiest users. Include people who need help reading, people with older devices, and people who choose a human route. Report how many people were invited, how many joined, and how many left. Explain missing records. Do not publish a strong success percentage after dropping every failed session.
The sample size should follow the smallest improvement worth detecting and the variation in real tasks. This paper cannot supply a universal number of participants. Run a small feasibility phase to learn about variation, then plan the comparison. Protect personal data, obtain appropriate consent, and seek the required oversight for any health study. Our proposed administrative pilot does not replace those requirements.
Useful technology should leave room for the physical world
The IEA estimates that data centres used about 485 TWh of electricity globally in 2025 and projects about 950 TWh in 2030 in its central outlook. These numbers cover all data centres, not AI alone. The future value is a projection, not a measured result. They cannot tell us the energy cost of one Egyptian app. L16
The Global E-waste Monitor reports 62 million tonnes of discarded electrical and electronic equipment in 2022, with 22.3% documented as formally collected and recycled. It includes many types of equipment. The remaining share is not automatically a measure of landfill waste. L17
Our design proposal is modest: use a large model only where it adds enough value. A rule, a database search, a small model, or a clear form may solve the task. Cache safe repeated results when the data and permissions allow it. Avoid sending the same work through several services without a reason. Support older devices and slow connections when possible.
Measure before making a green claim. A process may reduce travel but increase computing and hardware use. Define the boundary: which trips, devices, energy, and period are included? If a provider does not disclose enough information, say that the footprint is unknown. Do not turn fewer clicks into an invented carbon-saving number.
Nature is not a decoration around this argument. It is a reminder that systems use land, materials, electricity, and human attention. Progress can include repair, longer device life, less repeated work, and a service that lets someone finish quickly and return to life outside the screen. More technology is not, by itself, the outcome we should measure.

Better service. Less burden.
A practical path for Egypt, one service at a time
There is no evidence-based date when Egypt will become “fully evolved”. People are not a product version. A country can improve access and services while keeping cash, face-to-face care, paper backups, and personal choice where they remain useful. The better target is that people can complete important tasks safely, with less effort and fair access.
For a city team, begin with one shared service problem and a public measurement plan. Use the same task definition across participating districts. Publish where the sample came from and where it did not. Compare completion, time, support, and failure recovery. Avoid a league table that punishes a district for serving harder cases.
For a hospital, start with clear responsibility and safe administrative boundaries. For a small business, start with repeated work and total cost. For a bank or payment service, start with clear status, recognisable support, and recoverable mistakes. For an education team, test whether the person can perform a useful action independently after training, not whether they watched a tutorial.
For older users, give time, readable language, and control over assistance. For workers, explain what changes in their job and listen to the work that the system cannot see. For managers, reward early reporting of failures. If people fear punishment for finding a problem, the dashboard can look healthy while the service becomes worse.
The first stage is to observe. The second is a bounded pilot. The third is a measured expansion with a rollback plan. The fourth is continued review after the exciting launch period. These are proposed steps, not a claim that one method fits every institution. Each stage should leave evidence that another team can inspect.
Questions this paper does not answer
We cannot estimate the national share of Egyptians who fear technology. We cannot rank all cities by digital trust. We cannot infer older people’s attitudes from a young hospital sample. We cannot calculate foreign investment lost to electricity outages from the share of firms reporting them. We cannot promise that an AI system will save money in a company we have not measured.
The national data are broad and may be revised. The hospital studies have local samples and different methods. The enterprise survey excludes important parts of the economy. Company case reports may select successful projects. Public discussions have strong selection bias. The reliability benchmark and financial scenario have deliberately limited conditions. These limits shape the conclusions rather than cancel the value of the work.
The most useful unanswered question is how these barriers combine in one real journey. Does clearer recovery matter more than faster loading for a particular service? Does staff training help only when support is available? Do users keep control when a relative assists them? A well-designed local pilot can answer some of these questions. A large general article cannot answer them by confidence alone.
We also do not claim this is the first work to connect access, trust, and design. Our added value is practical: putting definitions beside numbers, exposing gaps, testing one failure pattern, and publishing a reusable decision model. The next version should improve through new data and documented corrections, not stronger adjectives.
Read the files, change an assumption, rerun the result
The download package contains machine-readable JSON and CSV, source and licence notes, Python acquisition and analysis code, and the recorded outputs. The public World Bank series is attributed under its data terms. Restricted source PDFs and personal social-media data are not repackaged as an open dataset. Short cited discussions remain linked to their originals.
Use a clean Python environment and the package instructions. Run the validation step before using the results. The acquisition script preserves supplied files by default and fetches the source PDF excluded from the ZIP so it can verify the survey table. Only its explicit --refresh option replaces the data snapshot. A new snapshot can contain revisions, so give a changed analysis a new date and keep both manifests.
The online charts have readable values and explanations. The calculator is a scenario, and the retry demonstration is a local model. Neither asks for personal records. The English and Egyptian Arabic editions use the same numerical findings. The PDFs preserve references and paper structure for readers who want to study or share a fixed version.
Readers should be able to challenge a number without having to trust the tool that wrote the sentence around it. Each downloadable result has a definition and a path back to its source or calculation. The fixed edition helps another team identify exactly what it is checking.
Build something people can use with confidence
My conclusion is not that Egyptians need to be pushed into technology faster. It is that useful services need to earn their place in daily life. Access matters. So do cost, support, control, reliable work, and the ability to recover from a mistake. A person’s hesitation can point to a design problem worth solving.
For Softworks, that means starting with the work itself. What is repeated? What fails? Who pays for the failure? What should remain a human decision? Then we can choose a small experiment, measure a real outcome, and build the next step from evidence. Sometimes that will include AI. Sometimes a simpler tool will be the better answer.
This paper is an invitation to make those decisions more visible. Share the source, the definition, the failure, and the correction. Keep the person using the service inside the story. Keep the physical world inside the cost. Make progress something we can explain and inspect.